Monday, July 18, 2016
After breakfast, Jim White (Director of the Institute of Arctic and Alpine Research at the University of Colorado) gave a presentation about the need to educate the public on the causes and effects of climate change.
Most of these climate changes will not affect our generation, but we need to think about future generations. Climate change will affect our water supply, our use of land and our politics. Our grandchildren will live in a very different world.
Climate change is not a debatable subject. Climate change is happening and it is happening abruptly – this is a fact. The debate has been whyclimate change is happening. Is it man-made, or just an evolutionary cycle?
Ice cores can reconstruct climate records through isotope analysis. By analyzing the atmospheric conditions in ice core data, scientists can predict future climates with similar conditions.
Recrystallized inclusions within the ice are a record of proxies for wind blown dust, ash, pollen, atmospheric gas bubbles, radioactive substances, ocean volume and local temperature.
This chart is a record of the different glacial and interglacial periods for the past 800,000 years.
In this chart, the blue is a glacial period and the yellow is interglacial. We are now in an interglacial period.
The numbers on the left side of this chart indicate the parts/per million of CO2 in the atmosphere. In this 800,000 year-timeframe, the atmospheric C02 level has not been above 280 parts/million.

By Tomruen - Data from ncdc.noaa.gov
Composite CO2 record (0-800 kyr BP), marked up with 230 ppm transition between glacial and interglacial periods., CC BY-SA 3.0
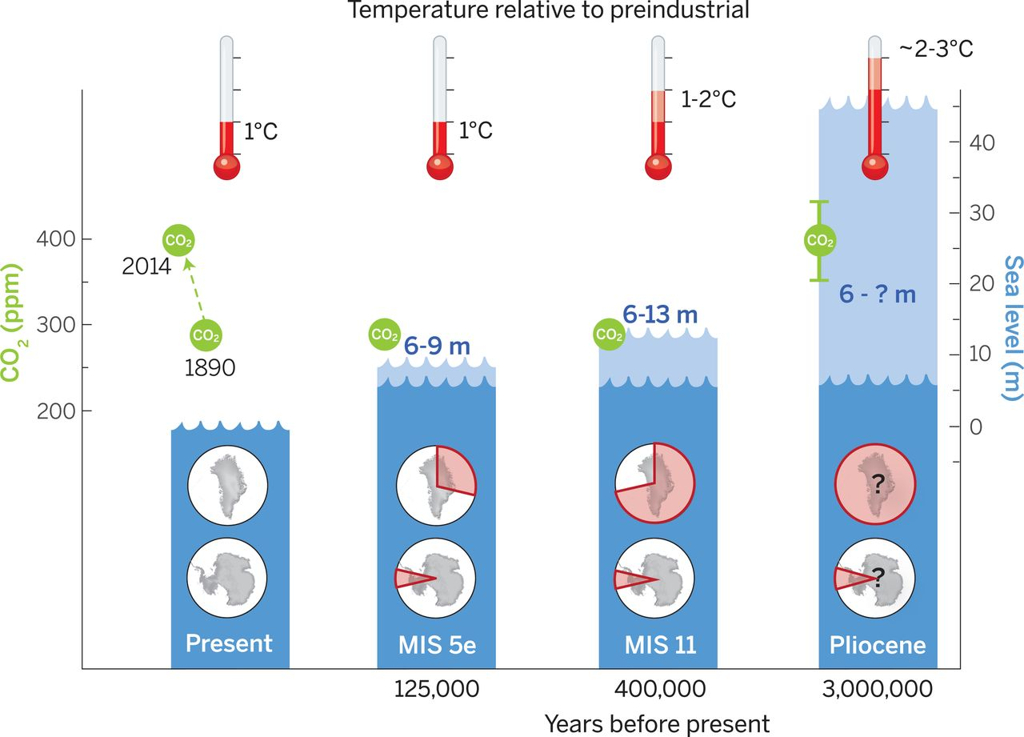
Peak global mean temperature, atmospheric CO2, maximum global mean sea level (GMSL), and source(s) of meltwater.
Light blue shading indicates uncertainty of GMSL maximum. Red pie charts over Greenland and Antarctica denote fraction (not location) of ice retreat.
Source: Dutton et al. (2005)
Today our CO2 level is at 405 parts/million. The last time the CO2 level was 400 parts/million was during the Pliocene Epoch, 3,000,000 years ago. At that time the temperature was 2-3 degrees C warmer, and the sea level 2-13 meters higher. Reef corals suffered a major extinction while forests grew up to the northern edge of the Arctic Ocean, a region that is now bare tundra.
This graph illustrates how the tropospheric (our lower atmosphere) greenhouse gas concentrations have changed during our interglacial period. Please note the abrupt increase in greenhouse gasses since 1750 (the industrial revolution).
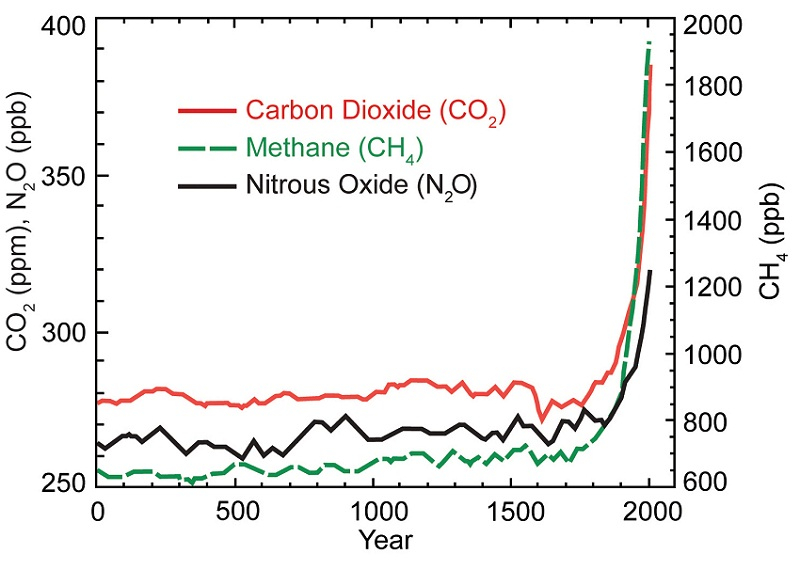
Life on earth as we know it depends on the existence of Greenhouse gasses, which keep the earth warm by absorbing and emitting infrared radiation. Currently, the Earth’s average surface temperature is 59 degrees F. Without Greenhouse gasses, it would be 0 degrees F. Our greenhouse gasses consist of Water Vapor, Carbon Dioxide, Nitrous Oxide, Methane, and Ozone. The contribution of each gas to the greenhouse effect is affected by the characteristics of that gas, its abundance, and any indirect effects it may cause. The atmospheric increase in CO2 allows for more heat to be absorbed into the Earth’s atmosphere. Methane is one of the strongest greenhouse gasses and has 29 times the impact on temperature than CO2.
Thirty–three percent of human methane emissions are due to the production, distribution and combustion of fossil fuels. Twenty-seven percent of methane emissions are due to the release of methane as a by-product of digestion that is exhaled or released via flatus by ruminant animals such as cows, sheep, and goats. The largest source of Nitrous Oxide is from the use of synthetic fertilizers in agriculture.
71% of the Earth’s surface is water.
The long-term effect of a warmer atmosphere is a warmer ocean. It will take many more years for the ocean to cool than the atmosphere to cool. An increase in temperature of the ocean will result in an increase in water vapor, which will also contribute to the greenhouse effect.
When water warms, it expands. Thermal expansion will contribute to 33% of the rise in the level of the ocean.
The other 66% of sea level rise will be due to the melting of Greenland’s ice sheet and the melting of mountain glaciers.
Jim’s presentation stimulated a lively dialogue that extended more than an hour.
What will happen with the population that will be displaced when our oceans rise and the Earth’s low-lying areas are flooded?
According to Climate Central estimates, more than 150 million people are currently living on land that will either be submerged or exposed to chronic flooding by 2100.
Source: Climate Central: 'Sea Levels Could Rise At Least 20 Feet'
The following maps illustrate which low-lying areas will be affected by a 13-meter rise in ocean level:


Our world population has doubled since 1970. How will we have enough food, energy and land to accommodate this growth? To control this, we must empower women politically and economically.
Bill Nye was our optimistic voice.
He had some ideas about changing our source of energy to reduce or keep our carbon footprint stable:
a) A fee on carbon – this would motivate the free market to innovate alternative forms of energy
b) Desalination of water by using graphene filters
c) Renewable fuels from plants such as genetically altered algae to produce diesel fuel
d) Liquid hydrogen-fueled jet planes.
After lunch, we went to a snow sampling room. In this room, Diane Vladimirova from the Alfred Wegener Institute (AWI) and Martin Madsen from the University of Copenhagen take samples and analyze this untouched snow for pollutants and gasses. This surface snow can measure high and low pressure changes and shifts in humidity.
Diane and Martin had created a ditch to look at the layers of snow, which were illuminated by the outside light. By analyzing these layers, they can determine the moisture in the snow during the past four years.


Evidence of Greenland's Ice Sheet Melt in 2012.